 |
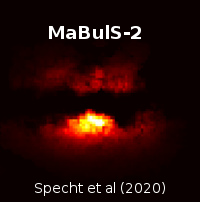
Manchester-Besançon Microlensing Simulator v2(MaBμlS-2)Version 2.3 (26/05/2021) |
 |
| Description | Changelog | Terms of use |
|
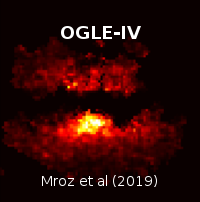
Use the form below to obtain signal-to-noise (S/N) limited microlensing maps of the Galaxy towards the Galactic bulge. MaBμlS-2 uses the Besançon Galactic Model. See here for a brief description and see our paper for more details on the calculations. For the magnitude range the min/max values refer to the bright and faint limit of a survey, respectively, and not the magnitude range of the source stars. The faint limit is taken to correspond to the magnitude at which the photon noise limited photometric precision is 4% within an aperture of radius 1 arcsecond. (i.e. when it is set to equal the survey zero-point magnitude an exposure time of 625 seconds is being assumed). All maps show the parameter distributions for events that exceed the selected event peak threshold S/N -- the minimum S/N at peak magnification. |
||